

Monitoring
Truework provides an API Dashboard that allows developers to monitor the health and performance of their production API integration, and to debug any issues that may arise in production.
The API Dashboard is currently only available in production. It is not yet available for the sandbox environment.
The API Dashboard provides developers several different types of data to gain insights about the health of their production Truework integration:
- Distribution of successful and failed API request over time, including failure type.
- Distribution of API response latency over time, including p50/90/95/99 latencies.
- Logs of each API request made by the account, including request and response headers and body.
Accessing the API dashboard
The API Dashboard is available on the Developer Settings page of the Truework Web App.
Using the API dashboard
The API Dashboard displays metrics and logs for your production API integration over a customizable timeframe. Users can select from preset relative date ranges, or specify their own custom date ranges.
API Dashboard metrics
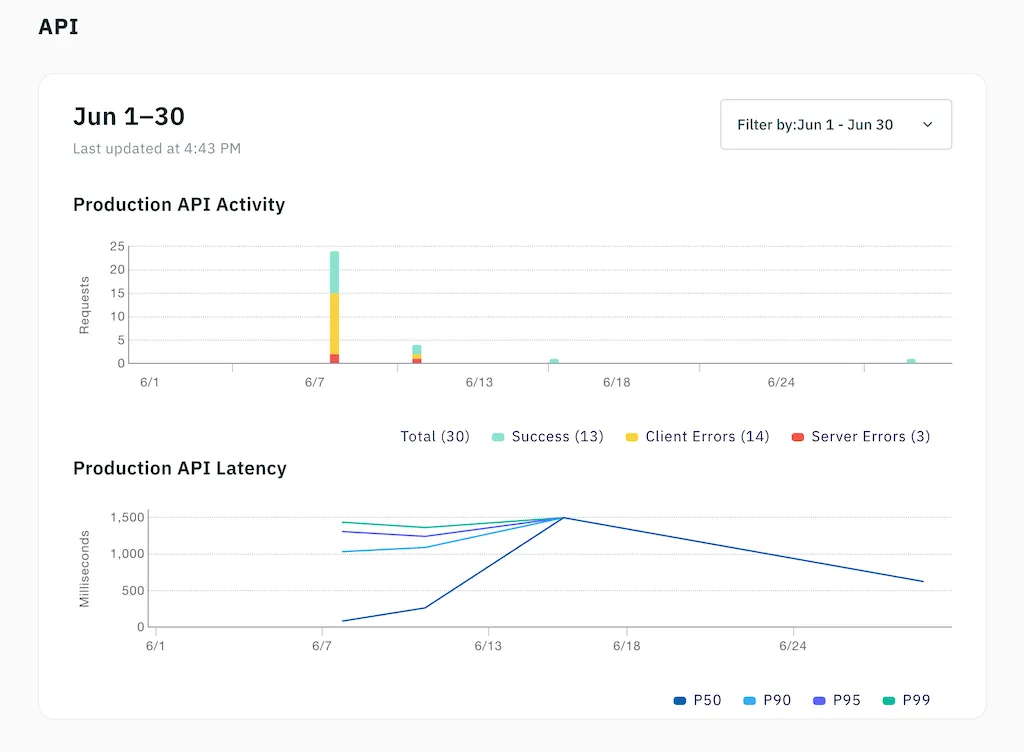
Two graphs are available to visualize API metrics over time:
- Production API Activity: A line chart of the number of API requests per day, broken down by response status: success (HTTP 2xx), client error (HTTP 4xx) or server error (HTTP 5xx).
- Production API Latency: A line chart of API response latency distribution per day, with indicators for the latency of the 50th- (median), 90th-, 95th- and 99th-percentile of all API requests for the day. The latency is calculated as the time between when Truework receives the request and when it sends the response.
API Dashboard logs
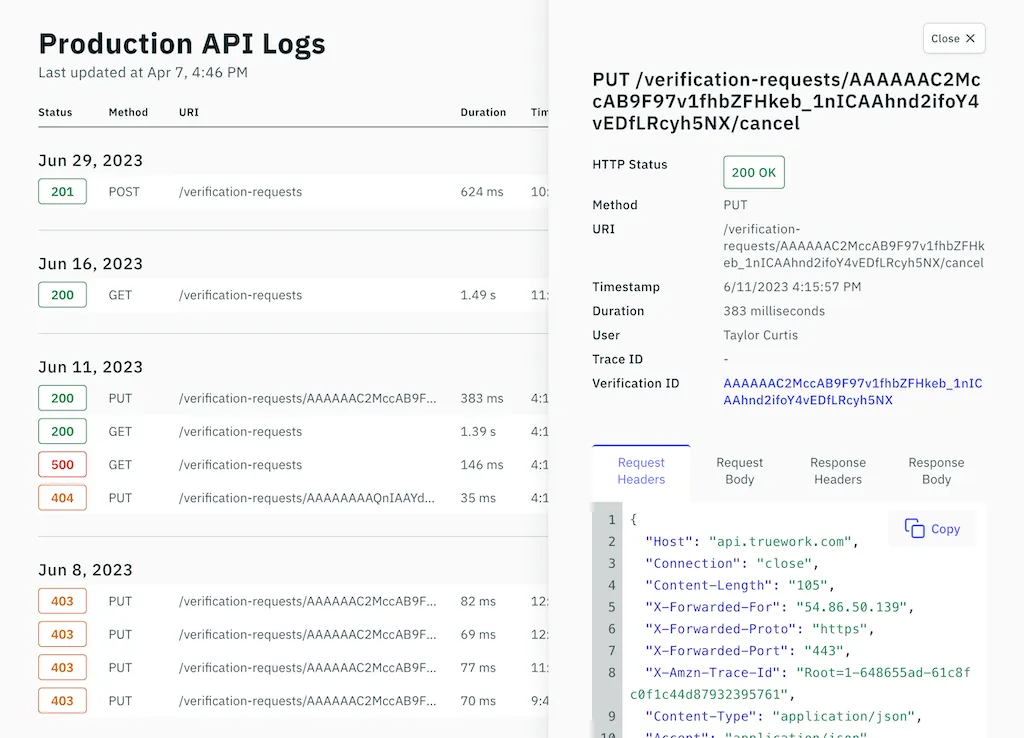
Production API Logs provides a record of all API requests made by the account. The request log can be filtered by date and also by request-specific filters such as HTTP status code, HTTP method, or the request Trace ID or URL. Individual requests can be selected to view all available details about the logged request, including the request and response headers and body.